Decarbon Daily - Emissions Calculations: Art or Science?
Inside this issue
Emissions Calculations: Art or Science?
Global Energy Demand
Countries around the world followed rigorous industrialization during 20th century as a pathway to bolster economic prosperity. Mass production of goods by machines, sharp increase in consumption of goods & services, brisk demand backed by persistent supplies, and progressive disposable income were all symbols of a prospering society.
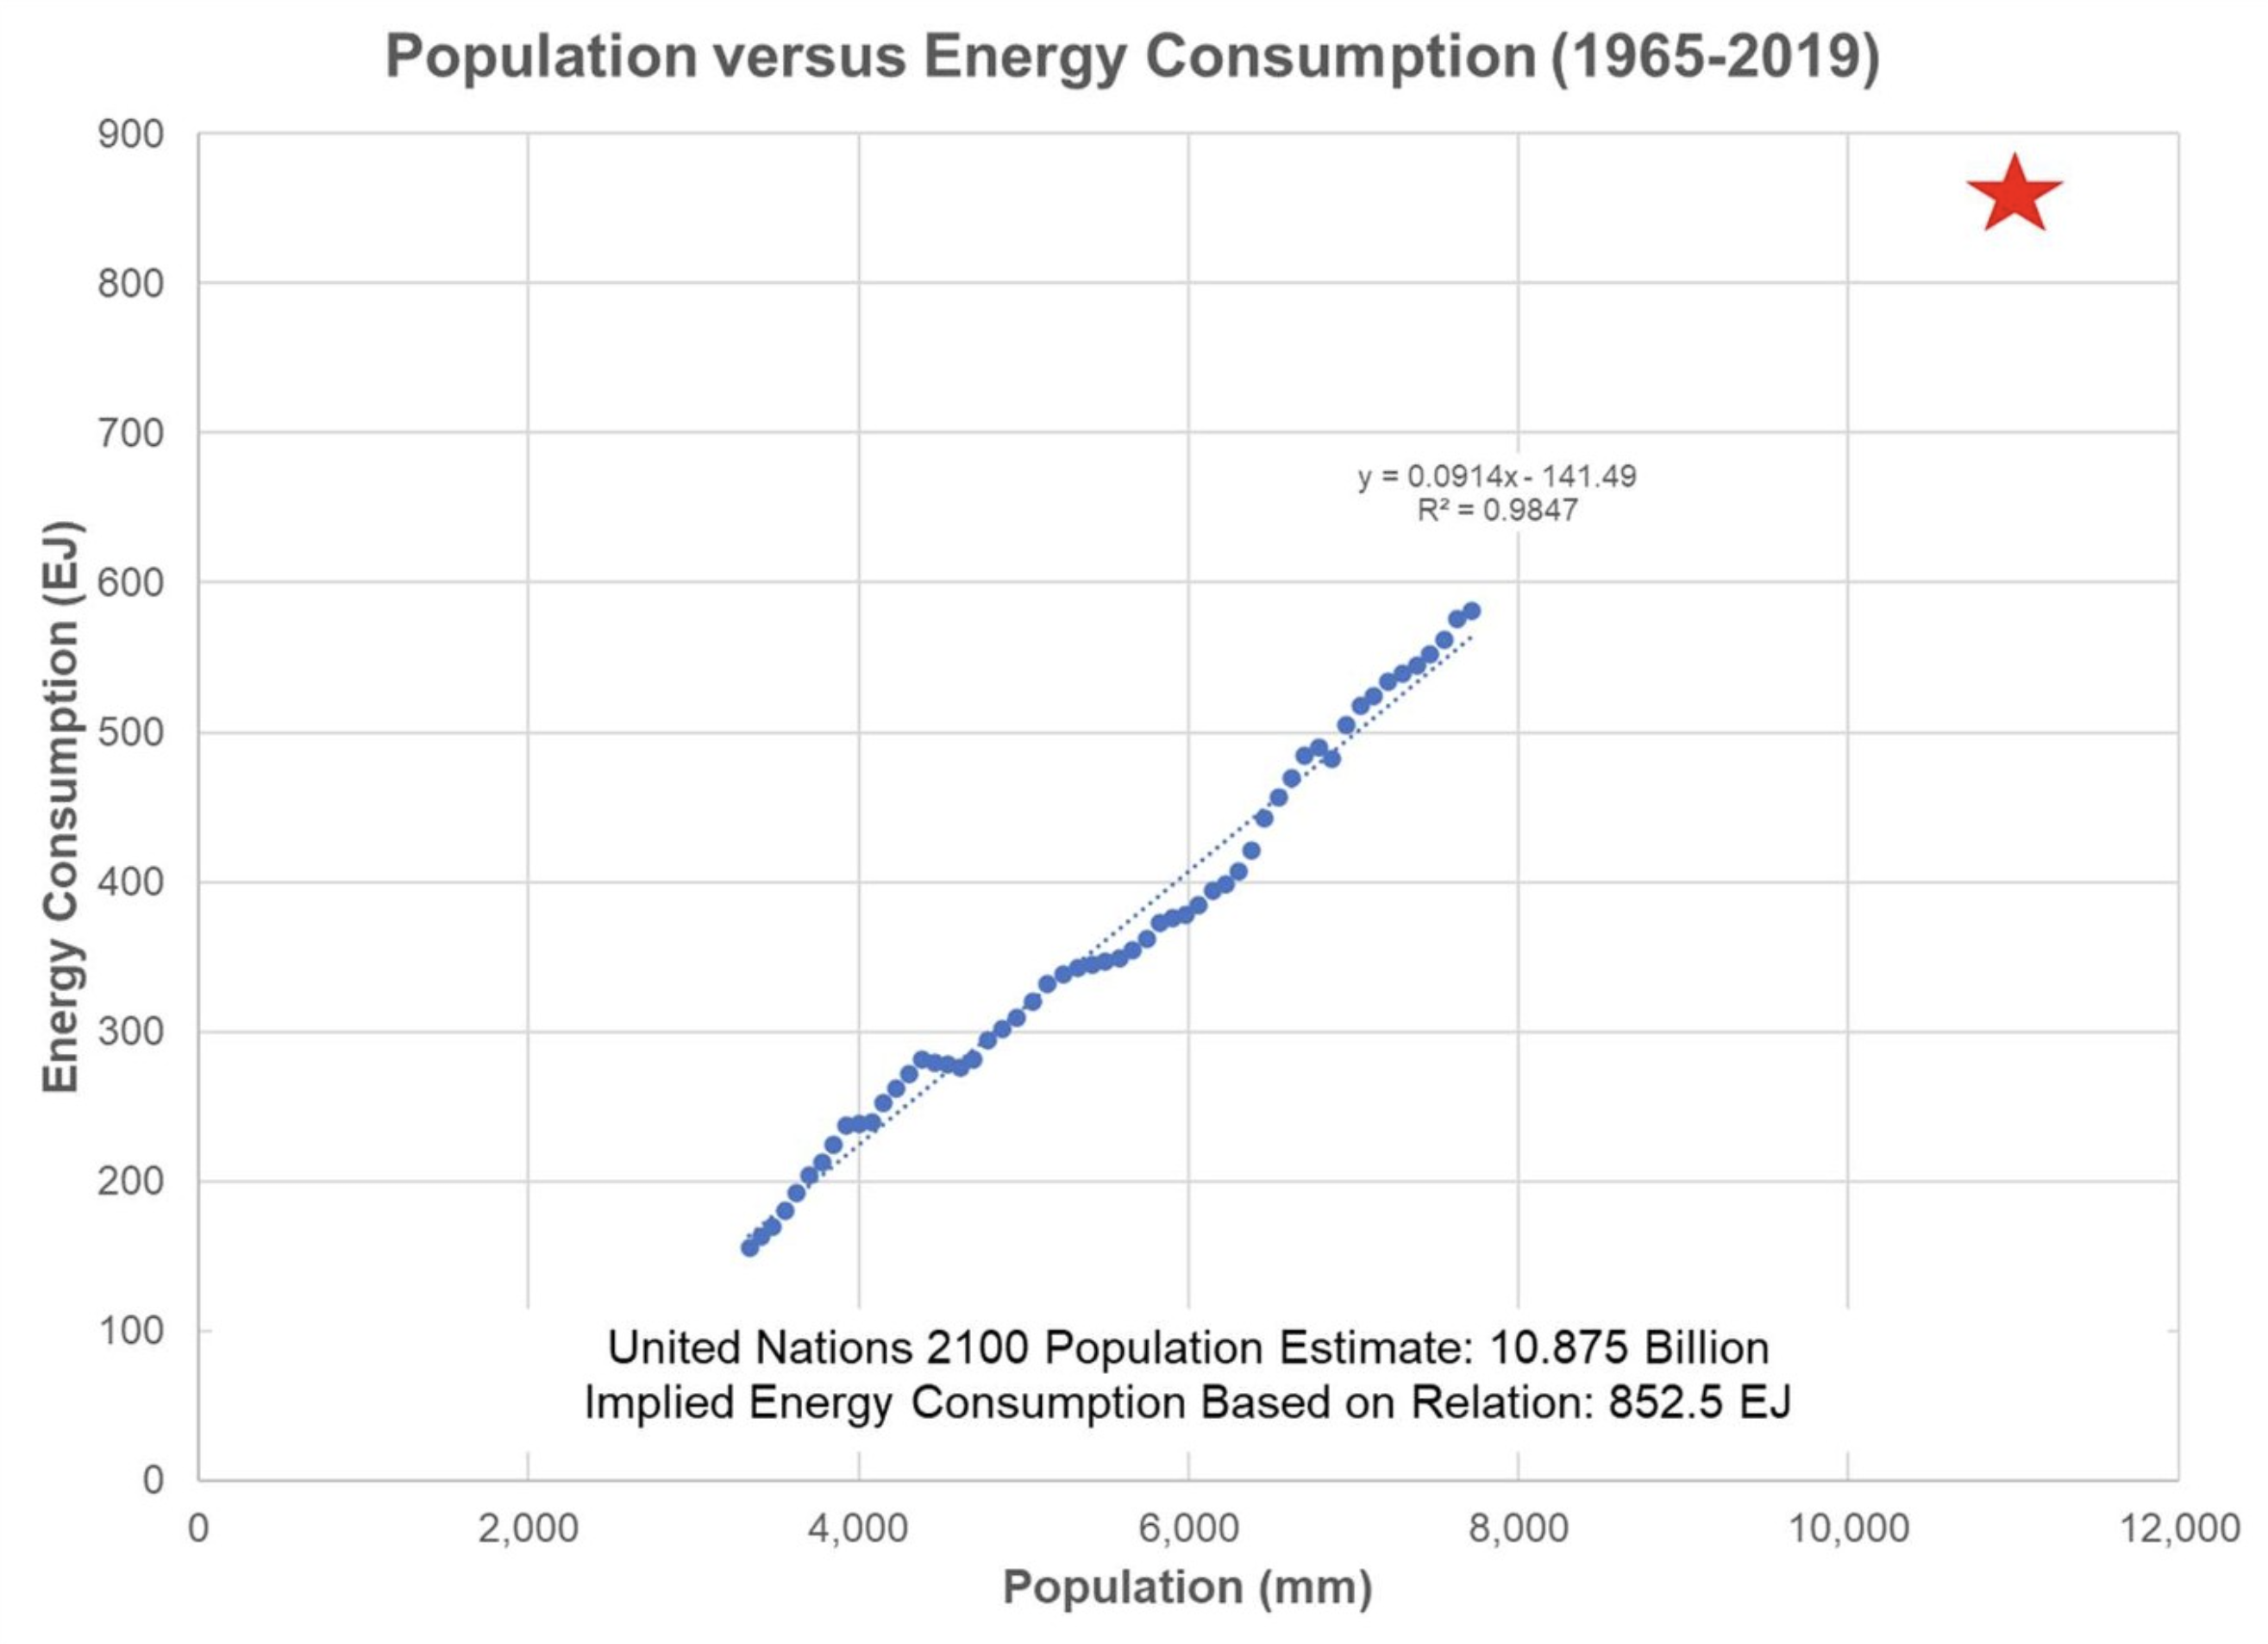
As global population increases energy demand is expected to increase. With an estimated population of 10.875 billion in 2100 the implied energy demand is 852 EJ. Here is the definition for exajoules (EJ) and other energy units.

Source: William Lacey
Population Correlation to Emissions
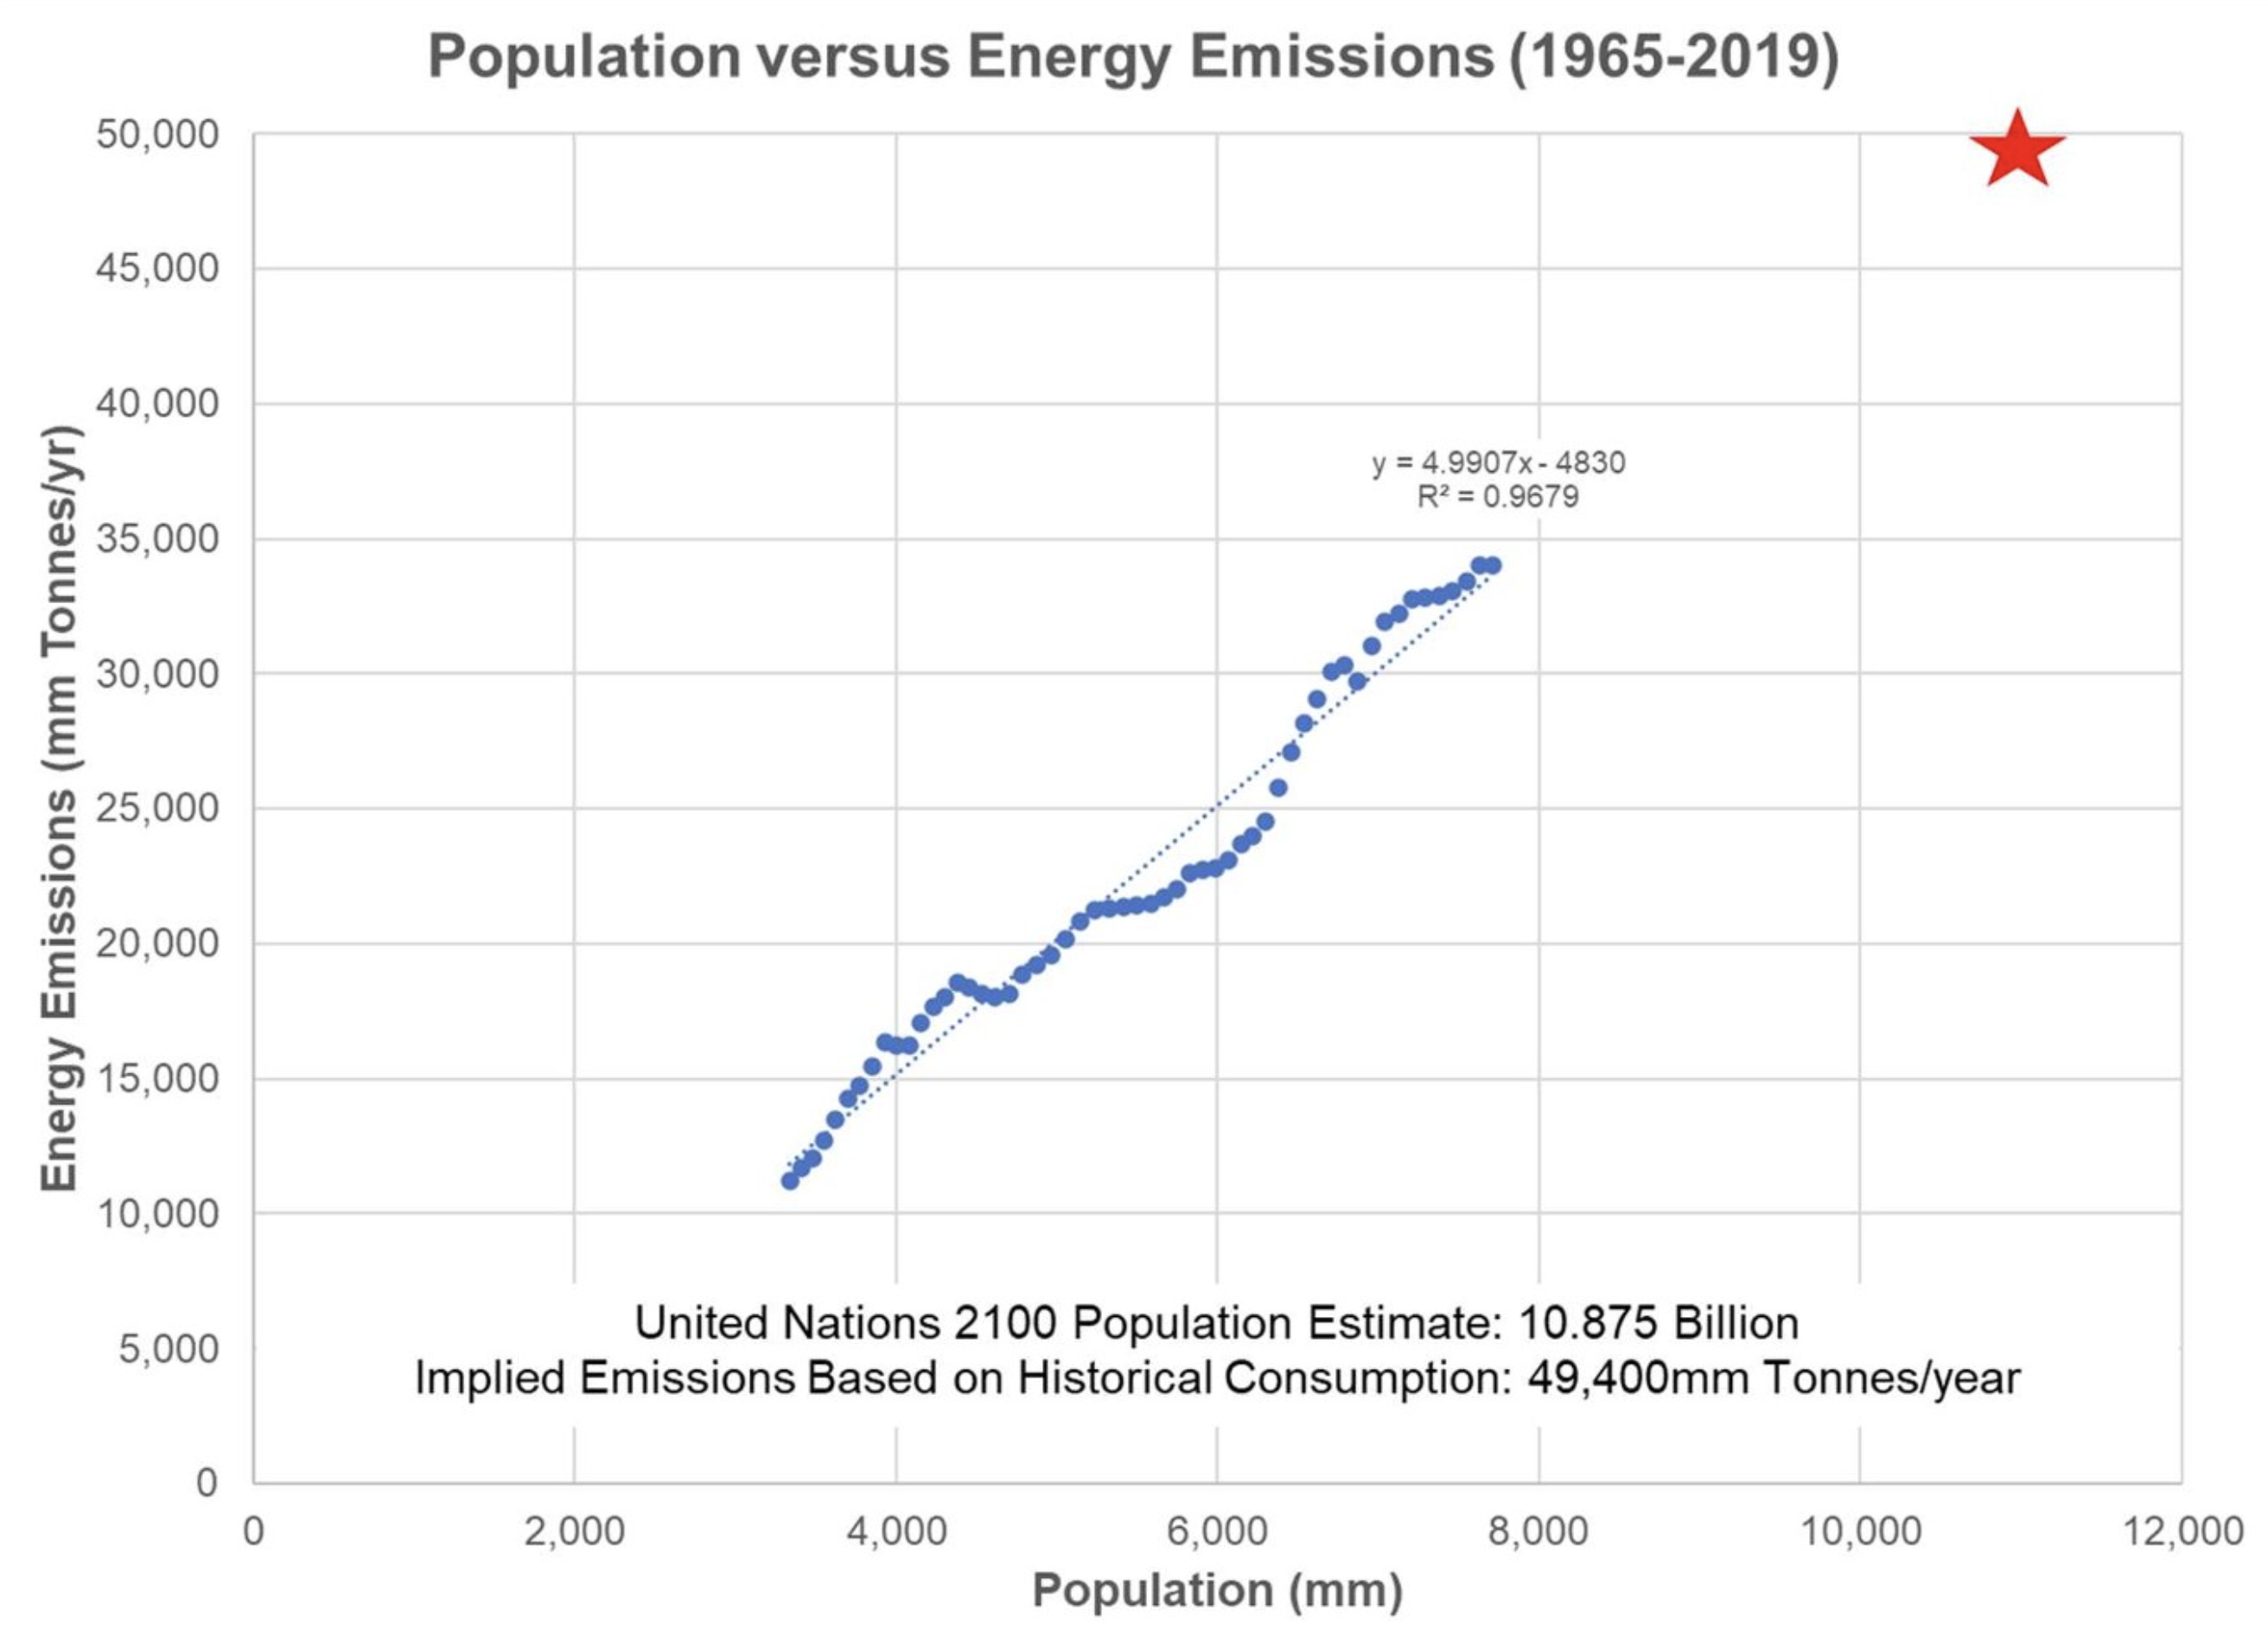
Energy intensive plant operations boosted production but increased pollution levels that led to significant increases in greenhouse gases. For instance, in power sector, electricity & heat generation account for over 40% of global energy related CO2 emissions (International Energy Agency (IEA), World Energy Outlook, 2019). In the chart below, you can see the correlation of the rise in population and the rise in energy emissions.

Source: William Lacey
Identifying Emissions at the Source
A critical element to carbon trading and offsets is traceability and transparency. For example, an industrial plant that is creating emissions may be able to capture and sequester CO2 at the plant site. Clear attribution and traceability of the source and sequester of CO2.
Complexity in Scope 1, 2, and 3 reporting. I've written briefly on the topic before in a supply chain context and decarbonization themes.
There are numerous solutions for capturing, measuring, and monitoring Scope 1, direct emissions. Moving beyond Scope 1, estimates and models come into play. The Greenhouse Gas Protocol offers market-based and location-based calculations for Scope 2. Finally, there is Scope 3 emissions. Greenhouse Gas Protocol says this:
The Scope 3 Standard provides a methodology that can be used to account for and report emissions from companies of all sectors, globally. It is accompanied by a suite of user-friendly guidance and tools developed by the GHG Protocol to make Scope 3 accounting more easy and accessible.
The EPA outlines GHG Emissions Factors to help companies understand and identify Scope 3 emissions, including:
- Upstream Transportation and Distribution (Category 4)
- Downstream Transportation and Distribution (Category 9)
- Waste Generated in Operations (Category 5)
- End-of-life treatment of sold products (Category 12)
- Business Travel (Category 6)
- Employee Commuting (Category 7)
Emissions Accounting and Estimates
Firms will strive to clearly identify and document Scope 1 emissions but as organizations move to capturing carbon credits for emissions, more third-party verification will be required. There is no independent verification of emissions.
Certainly, there are companies like Project Canary that aim to solve this emission reporting challenge; however, investors, communities, and constituents will expect more transparency especially as carbon markets open their doors across the world.
Inside this Issue
🛰 How Satellites Could Help Hold Countries to Emissions Promises Made at COP26 Summit
🌎 Klima DAO: Climate Action Through Carbon Pricing
☁️ Greenhouse Gas Equivalencies Calculator
🏭 CH4 is Today's Climate Action. What You Should Know about the EPA & Methane
Articles in this issue